The Long Run
September 28, 2022

Robert Hajduch, Managing Director, Taxable Credit Research
Despite the Federal Reserve (Fed) pursuing its most aggressive monetary tightening cycle since the late-1970s, domestic bank balance sheets are exhibiting historic strength in defiance of conventional expectations. A typical tightening cycle inherently implies slowing economic growth, which drives rising unemployment that manifests as deteriorating asset quality as businesses and consumers have trouble servicing debt. That stress generally induces concurrent attrition in the system’s deposit base, with banks being pressured from both the asset and liability sides of the balance sheet. Through the end of the second quarter (Q2) of 2022, evidence of deterioration is visibly lacking.
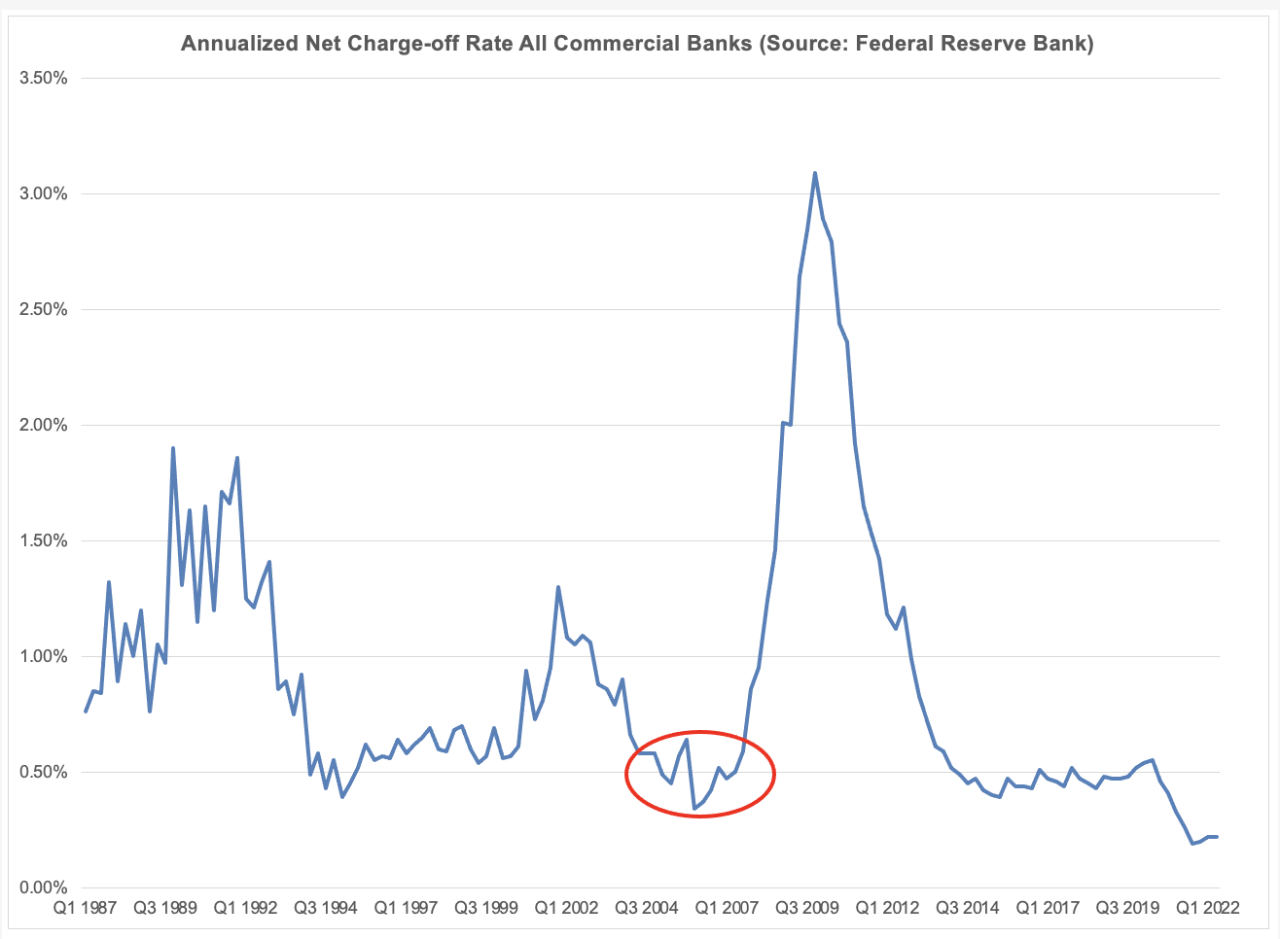
For perspective, the following charts illustrate loan asset quality performance looking back to the first quarter of 1987 and spanning the last four credit cycles. The first chart, titled “Annualized Net Charge-off Rate – All Commercial Banks,” tracks historic loan losses, with visible volatility corresponding to the savings and loan and farm crises in the late-1980s into the early-1990s, the recession following the 2001 terrorist attacks and the violent upsurge in 2009 following the 2008 panic. By contrast, the increase in loan losses in 2020 following the COVID outbreak barely registers as a ripple. More recent experience is better than that reported across 2004 to 2007 (circled), in which net charge-offs hit the lowest level reported since the Reagan Administration.

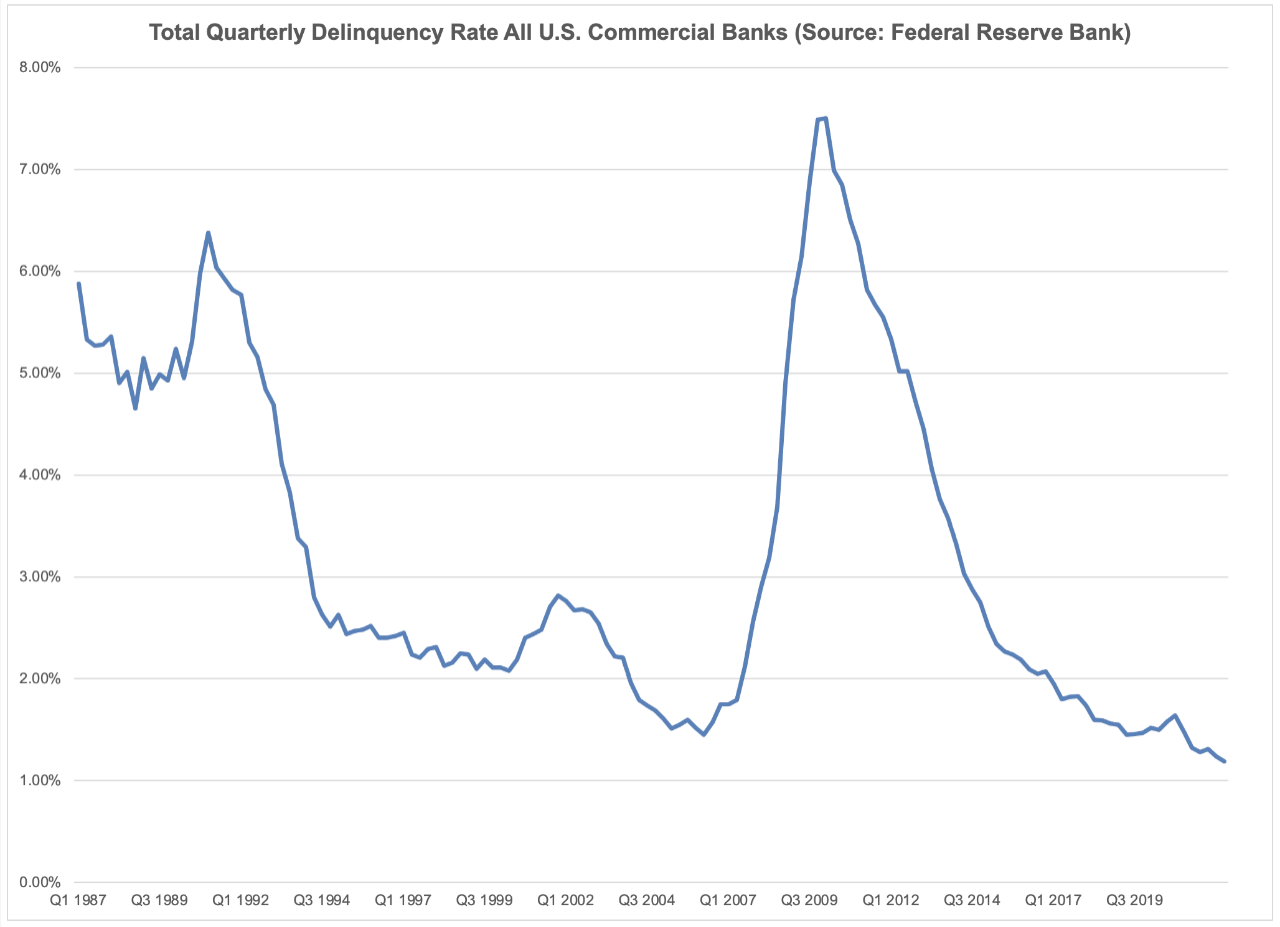
Delinquency rates have largely mirrored loss rates, as seen in the chart below, with the notable exception of a positive trend through the end of the second quarter of 2022, with total delinquencies improving to 1.19% of total gross loans. That the delinquency rate has continued to track lower is unambiguously positive, as it is a leading indicator for the direction of loan losses.

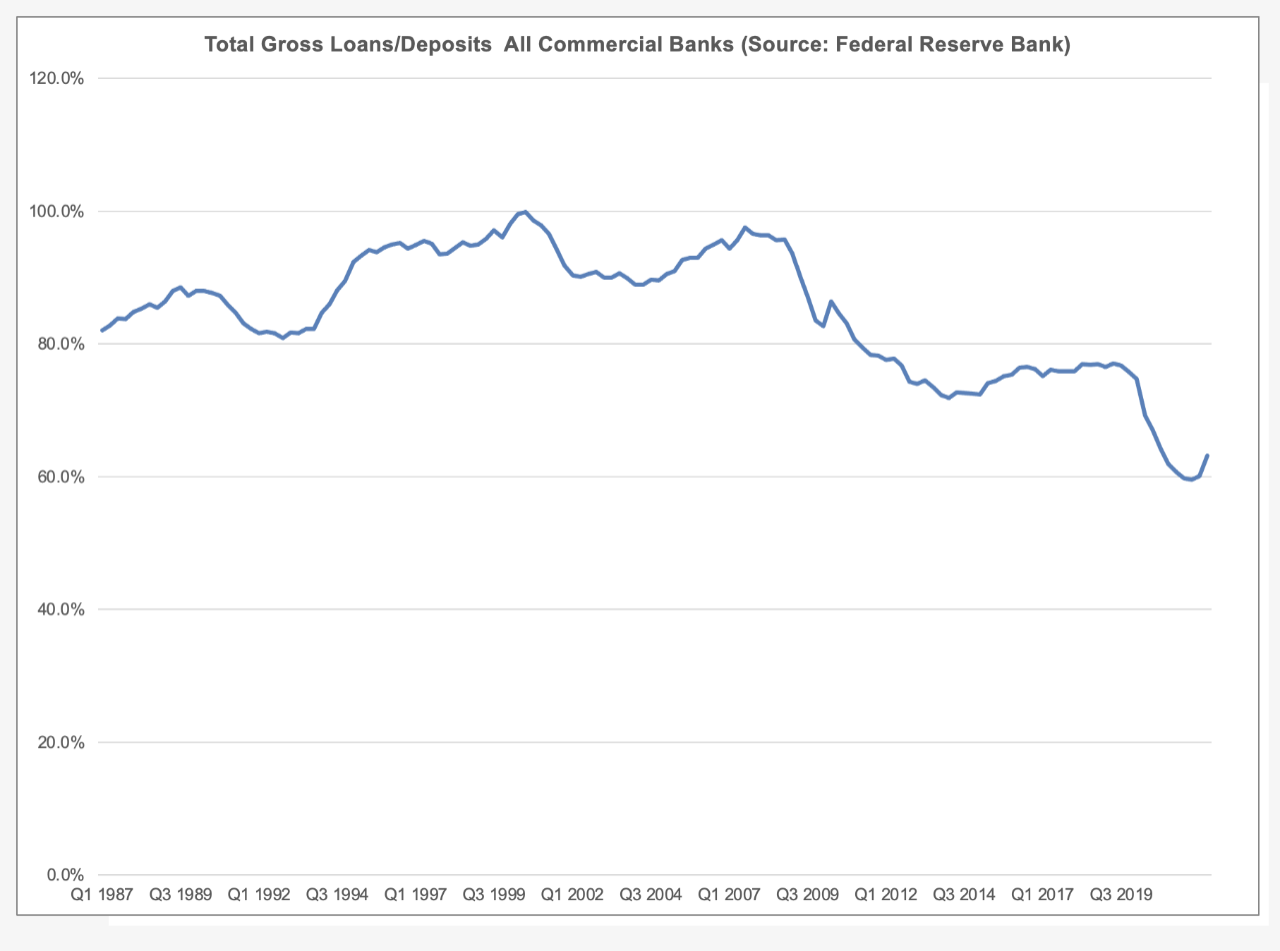
Even as asset quality stability has supported bottom-line earnings performance, quantitative easing by the Fed in early 2020 poured liquidity into the economy, with total system deposits increasing by $4.9 trillion between Q4 2019 and Q1 2022, as illustrated in the chart below. Over the same time period, total outstanding gross loans only increased by $862.1 billion, with the system reporting $7.3 trillion in excess deposits at the end of 2021. This confluence propelled the loans to deposits ratio to 59.5% at the end of 2021.

Loan growth in 2022, coupled with deposit outflows, has pushed the loans to deposits ratio back above 60%. However, it remains exceptionally low versus the average level since the first quarter of 1987, which approached 85%.
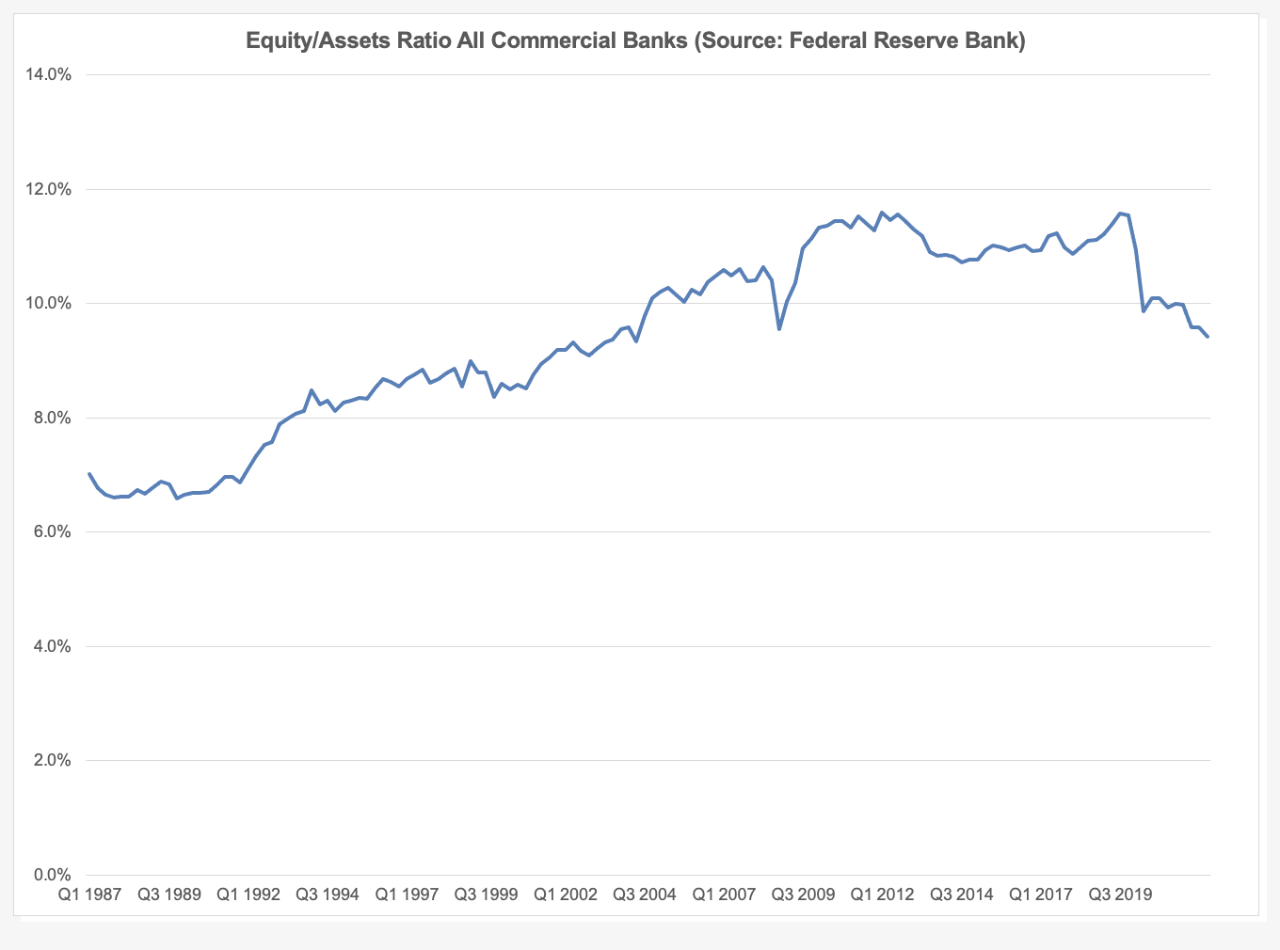
The sole balance sheet measure that has weakened since pre-COVID is the total equity to total assets ratio, which has fallen below 10% for the first time since Q1 2009. However, this optical deterioration is illusory given that it resulted from the Fed-propelled wave of deposits flowing into the system, which expanded balance sheets rather than eroding the equity base, demonstrated in the chart below.

Between year-end 2019 and the end of Q2 2022, total balance sheet equity increased by $75.3 billion, or 3.7%. Over the same time span, total balance sheet assets ballooned by $4.8 trillion (27%), $4.7 trillion of which was accounted for by deposit inflow. As loan demand was weak until the second half of 2021, virtually all new deposits were either deposited with the Federal Reserve Bank or invested in U.S. Treasury or agency securities. The balance sheet expansion consequently did not result in an expanded risk profile of assets.
Our long-term view is that the domestic banking system appears well positioned to manage through potential upcoming economic turbulence, and we remain confident with our positioning within the sector.
Sources
USBAM Research
Federal Reserve Bank H.8 Report Data
https://www.federalreserve.gov/releases/h8/current/default.htm