Quarterly Portfolio Manager Commentary
June 30, 2024

Cash Management Portfolios
What market conditions had a direct impact on the bond market this quarter?
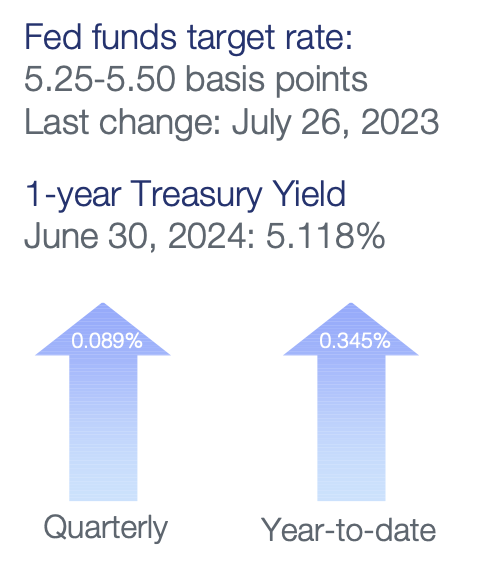
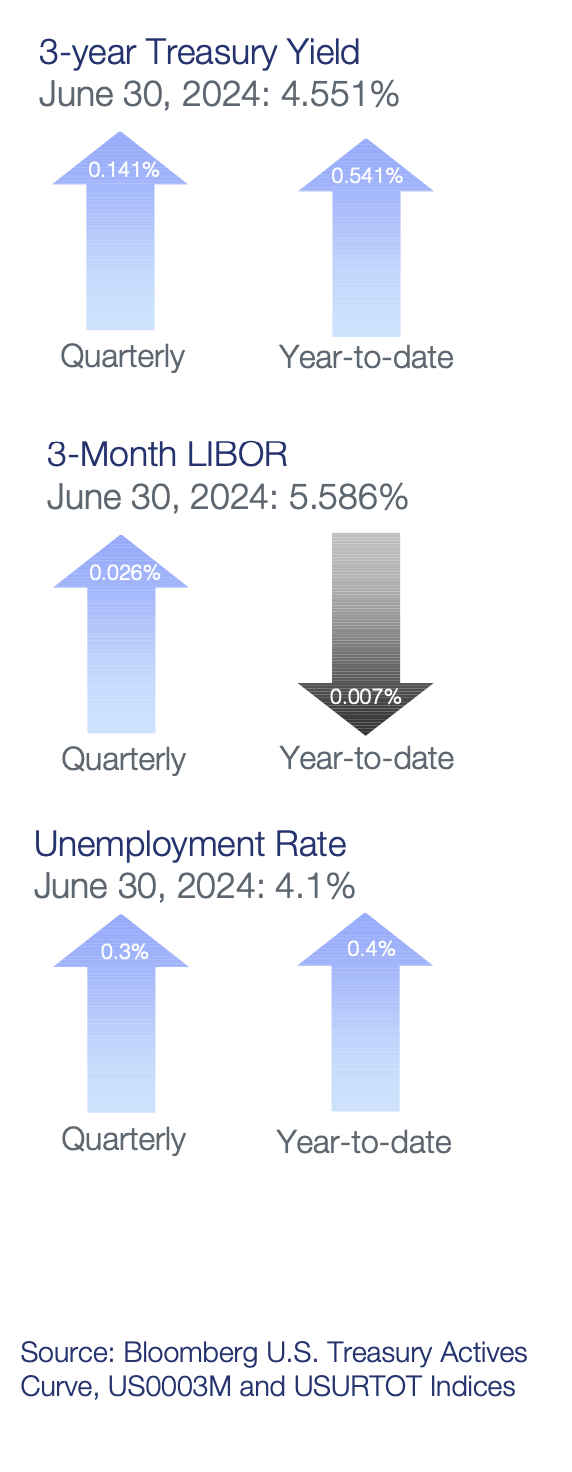
Economic Activity – The lagged effects of Federal Reserve (Fed) monetary policy tightening appear to be having a greater impact on U.S. economic activity. Inflation pressures eased throughout the second quarter (Q2) while spending slowed and employment conditions came into better balance, precisely what the Fed has been looking for. Q2 U.S. Gross Domestic Product (GDP) growth is projected to be near 1.5% to 2.0% amid slower consumer spending and private investment. Personal consumption decelerated throughout Q2 as consumers continue to pull back on discretionary spending amid elevated prices and high interest rates. May U.S. job openings declined to 8.1 million open positions compared to 8.4 million at the end of Q1, while total unemployed workers in the labor force as of June rose to 6.8 million, reflecting strong immigration and a higher participation rate. Monthly Non-farm Payrolls (NFP) growth decelerated to an average of 177,000 during Q2, nearly 100,000 below Q1’s pace, and the U3 Unemployment Rate climbed to 4.1% in June. Average Hourly Earnings growth is off its highs but remains elevated at 3.9% year-over-year (YoY), emphasizing still-solid labor demand. The Consumer Price Index (CPI) eased to 3.3% in May versus 3.5% in March, suggesting inflation’s reacceleration to start the year was not a trend. Core inflation continued its gradual downward trend with CPI ex. food and energy rising 3.4% YoY for May compared to 3.8% YoY in March. The Fed’s preferred inflation index – the PCE Core Deflator Index – increased 2.6% YoY for May. While recent inflation data has been encouraging, sustained inflation near the Fed’s 2% target will require below-trend growth and further loosening in the labor market, running counter to the Fed’s “goldilocks” projections and raising concerns the Fed will need to orchestrate a broader economic slowdown to get inflation back to target.
Monetary Policy – As markets expected, the Fed kept its federal funds target range unchanged at 5.25% to 5.50% at the May 1 and June 12 meetings, with minimal changes made to the Fed’s post-meeting statement’s characterization of the economy. Fed officials noted “modest progress” has been made toward their 2% inflation target, but greater confidence inflation is moving sustainably toward target is needed before reducing policy rates. In June, the Fed began slowing its balance sheet reduction program (quantitative tightening) by reducing the monthly cap on Treasury securities from $60 billion to $25 billion. The Fed is maintaining the $35 billion cap on agency mortgage-backed securities.
The Federal Open Market Committee (FOMC) released its updated Summary of Economic Projections at the June meeting which showed a slightly higher core inflation forecast than the prior release and unchanged unemployment rate and GDP growth forecasts. Revisions to economic assumptions in 2025 and 2026 were minimal. The median projection for the federal funds rate at the end of 2024 was revised to a range of 5.0% to 5.25%, now showing 25 basis points (bps) of rate cuts this year compared to 75 bps in the March projections. The median dot now shows 100 bps of cuts in both 2025 and 2026 (versus 75 bps each in the March projections), keeping cumulative cuts through 2026 unchanged. The economic projections continue to reflect a best-case scenario, implying inflation can decline toward the Fed’s 2% target without a slowdown in growth or deterioration in unemployment. Currently, growth is above long-term potential and employment demand continues to be strong and is not likely to slow to a point where prices would begin to decline (i.e. inflation falling). We believe for inflation to decline back to 2% we will either need a period of below-potential growth or higher unemployment. It is difficult to see inflation fall back to target without one or both of these things happening.
Fiscal Policy – After narrowly avoiding a government shutdown in March, fiscal policy action was quiet in Q2 and is expected to remain muted over the coming months as Washington D.C.’s focus fully shifts to the upcoming elections. Policy action will intensify later this year as the Biden administration and Congress will need to contend with passing a budget for fiscal year 2025 (starts October 2024), but we suspect a series of continuing resolutions will be used to get through the November elections. Additionally, the U.S. government debt ceiling will be reinstated January 1, 2025, with the Treasury expected to use extraordinary measures to push the deadline into summer 2025, allowing Congress further time to reach a deal.
Looking further out, the Infrastructure and Jobs Act (2021) and Inflation Reduction Act (2022) will boost government spending over the long-term, but near-term impacts are likely to be minor. On the municipal side, state and local government finances are starting to diverge with municipal entities more dependent on sales and property taxes faring better than those dependent on income taxes, but strong reserves have left the overall sector in a solid position should economic conditions weaken further.
Credit Markets – U.S. Treasury yield curve steepened in the quarter as continued better-than-expected economic growth pushed out the start of anticipated 2024 Fed rate cuts. Credit spreads were essentially unchanged in the quarter as strong demand for yield and spread product kept pace with corporate supply. Credit spreads are tight on a historical basis as financial conditions remain accommodative. Elevated index yields provide a cushion against the negative price action of higher rates, with credit sensitive and short treasury indexes posting overall positive returns for the quarter despite higher long-term rates.
Yield Curve Shift
|
U.S. Treasury Curve |
Yield Curve 3/31/2024 |
Yield Curve 6/30/2024 |
Change (bps) |
|---|---|---|---|
|
3 Month |
5.362% |
5.355% |
-0.7 |
|
1 Year |
5.024% |
5.110% |
8.6 |
|
2 Year |
4.620% |
4.753% |
13.3 |
|
3 Year |
4.409% |
4.550% |
14.1 |
|
5 Year |
4.212% |
4.377% |
16.4 |
|
10 Year |
4.200% |
4.396% |
19.6 |
Duration Relative Performance

*Duration estimate is as of 6/30/2024
The three-month to five-year portion of the yield curve steepened 17.7 bps in the quarter as longer-end yields rose as Fed rate cut expectations were pushed out. There was a fair amount of yield volatility intra-month, with two-year yields peaking over 5.00% in late April, which provided an opportunity for portfolios to extend duration and lock in yields. The steepening yield curve benefitted portfolios with a shorter duration and a more bulleted structure with higher exposure to front-end positioning.
Credit Spread Changes
|
ICE BofA Index |
OAS* (bps) 3/31/2024 |
OAS* (bps) 6/30/2024 |
Change (bps) |
|---|---|---|---|
|
1-3 Year U.S. Agency Index |
9 |
5 |
-4 |
|
1-3 Year AAA U.S. Corporate and Yankees |
10 |
10 |
0 |
|
1-3 Year AA U.S. Corporate and Yankees |
29 |
31 |
2 |
|
1-3 Year A U.S. Corporate and Yankees |
55 |
56 |
1 |
|
1-3 Year BBB U.S. Corporate and Yankees |
85 |
82 |
-3 |
|
0-3 Year AAA U.S. Fixed-Rate ABS |
55 |
55 |
0 |
Option-Adjusted Spread (OAS) measures the spread of a fixed-income instrument against the risk-free rate of return. U.S. Treasury securities generally represent the risk-free rate.
For the most part, credit spreads were unchanged in the second quarter. Credit spreads on a historical basis are relatively tight, which allows little room for further improvement from current levels. Credit spreads in the investment-grade sector have benefitted from continued solid growth and generally accommodative financial conditions. AAA-rated ABS spreads and single-A U.S. corporate debt ended the quarter with almost identical OAS spreads.
Credit Sector Relative Performance of ICE BofA Indexes

ICE BofA Index
*AAA-A Corporate index outperformed the Treasury index by 8.7 bps.
*AAA-A Corporate index underperformed the BBB Corporate index by 14.9 bps
*U.S. Financials outperformed U.S. Non-Financials by 7.6 bps
U.S. financials outperformed non-financial corporate debt primarily due to its higher coupon advantage, as spreads for both sectors remained roughly unchanged. BBB credit outperformed AAA-A credit as demand for spread product and corporate debt remained strong in the quarter.
What strategic moves were made and why?
Taxable Portfolios – Despite the significant jump in U.S. Treasury yields, most short fixed-income portfolios and indexes generated positive returns in the quarter. Elevated portfolio yield-to-maturity levels and tighter credit spreads cushioned portfolios against the negative price action of higher rates. As expected, when yields moved higher, shorter duration strategies outperformed their longer duration counterparts. Credit strongly outperformed U.S. Treasuries on higher coupons and spread tightening in the quarter, particularly for ABS, financials, and A- and BBB-rated corporate debt in general. There were no significant credit or rating events in the quarter, and no single issuer or position had a meaningfully negative impact on portfolio performance.
Tax Exempt and Tax-Efficient Portfolios – The frenetic pace of municipal borrowing in Q2 dominated conversations of market participants and led many strategists to increase their end-of-year supply forecasts. Total volumes of all municipal debt (tax-exempt and taxable) exceeded $236 billion YTD through June – a 37% increase versus 2023 and a new record for first-half issuance. The surging new issue calendar can largely be attributed to pent-up infrastructure needs after many issuers delayed plans for new projects due to last year’s extreme rate volatility. Other factors for higher sales include a desire to avoid election uncertainty later this year, as well as a greater realization that hopes for substantially lower rates may not come to fruition, at least in the near term. These market conditions certainly favored new buyers, with yields adjusted higher on a regular basis throughout April and ultimately peaking in May. It was a terrific opportunity to extend portfolio durations, and after being short versus benchmarks for several quarters, we welcomed the chance to move some portfolios to neutral levels. For those accounts that placed a greater value on liquidity and favored shorter durations, variable rate demand notes (VRDNs) provided attractive current income. For the quarter, VRDNs averaged 3.64%.
How are you planning on positioning portfolios going forward?
Taxable Portfolios – The back-up in U.S. Treasury yields offers an opportunity to extend fixed income portfolios closer to or at benchmark duration. Quarter-end yield curve levels represent solid entry points, and we believe the balance of risks is skewed toward lower rather than higher rates in the second quarter. We base this outlook on our view; 1) we have reached peak policy rates, 2) the Fed’s reaction function is asymmetric, as policymakers will tolerate stronger economic or employment data but are prepared to ease should conditions weaken, and 3) the market is biased to take rates down, meaning the weight of evidence must convincingly be on the side of sustained or re-acceleration of growth and/or inflation to move yield curve levels meaningfully higher. Credit spreads have performed well in recent quarters, and certain measures indicate corporate credit – particularly high-quality industrial issuers – is tight from a historical level. Despite tighter credit valuations, we will maintain on overweight to credit as improved prospects for a soft landing enhance and accommodative financial conditions bolster the outlook for corporate credit quality and, in turn, the relative value of corporate credit spreads. While consumer credit metrics show signs of deterioration, particularly for sub-prime borrowers, we continue to focus on well-structured prime auto, credit card and equipment loan AAA-rated ABS yielding comparable to single-A rated corporates.
Tax Exempt and Tax-Efficient Portfolios – We are content, for the most part, with current positioning and anticipate making only minor adjustments in the coming months. Municipal market conditions appear likely to shift in a sharp way as we enter the third quarter. In fact, one prominent municipal strategist estimates negative net supply of nearly $30 billion during July. While this will be a positive for municipal bond holders, the entry levels for new purchases are not expected to be favorable. We continue to believe it is prudent to keep portfolio durations near benchmarks, and accordingly, we will remain active as needed to meet that objective. We also remain mindful that potential scenarios involving economic weakness could usher in some drastically different expectations for Fed easing than what is currently priced into the yield curve.
Sources
Bloomberg
https://about.bgov.com/brief/the-presidents-fy25-budget-request/
https://www.federalreserve.gov/monetarypolicy/files/monetary20240501a1.pdf
https://www.federalreserve.gov/monetarypolicy/files/monetary20240612a1.pdf
https://www.federalreserve.gov/monetarypolicy/files/fomcprojtabl20240612.pdf